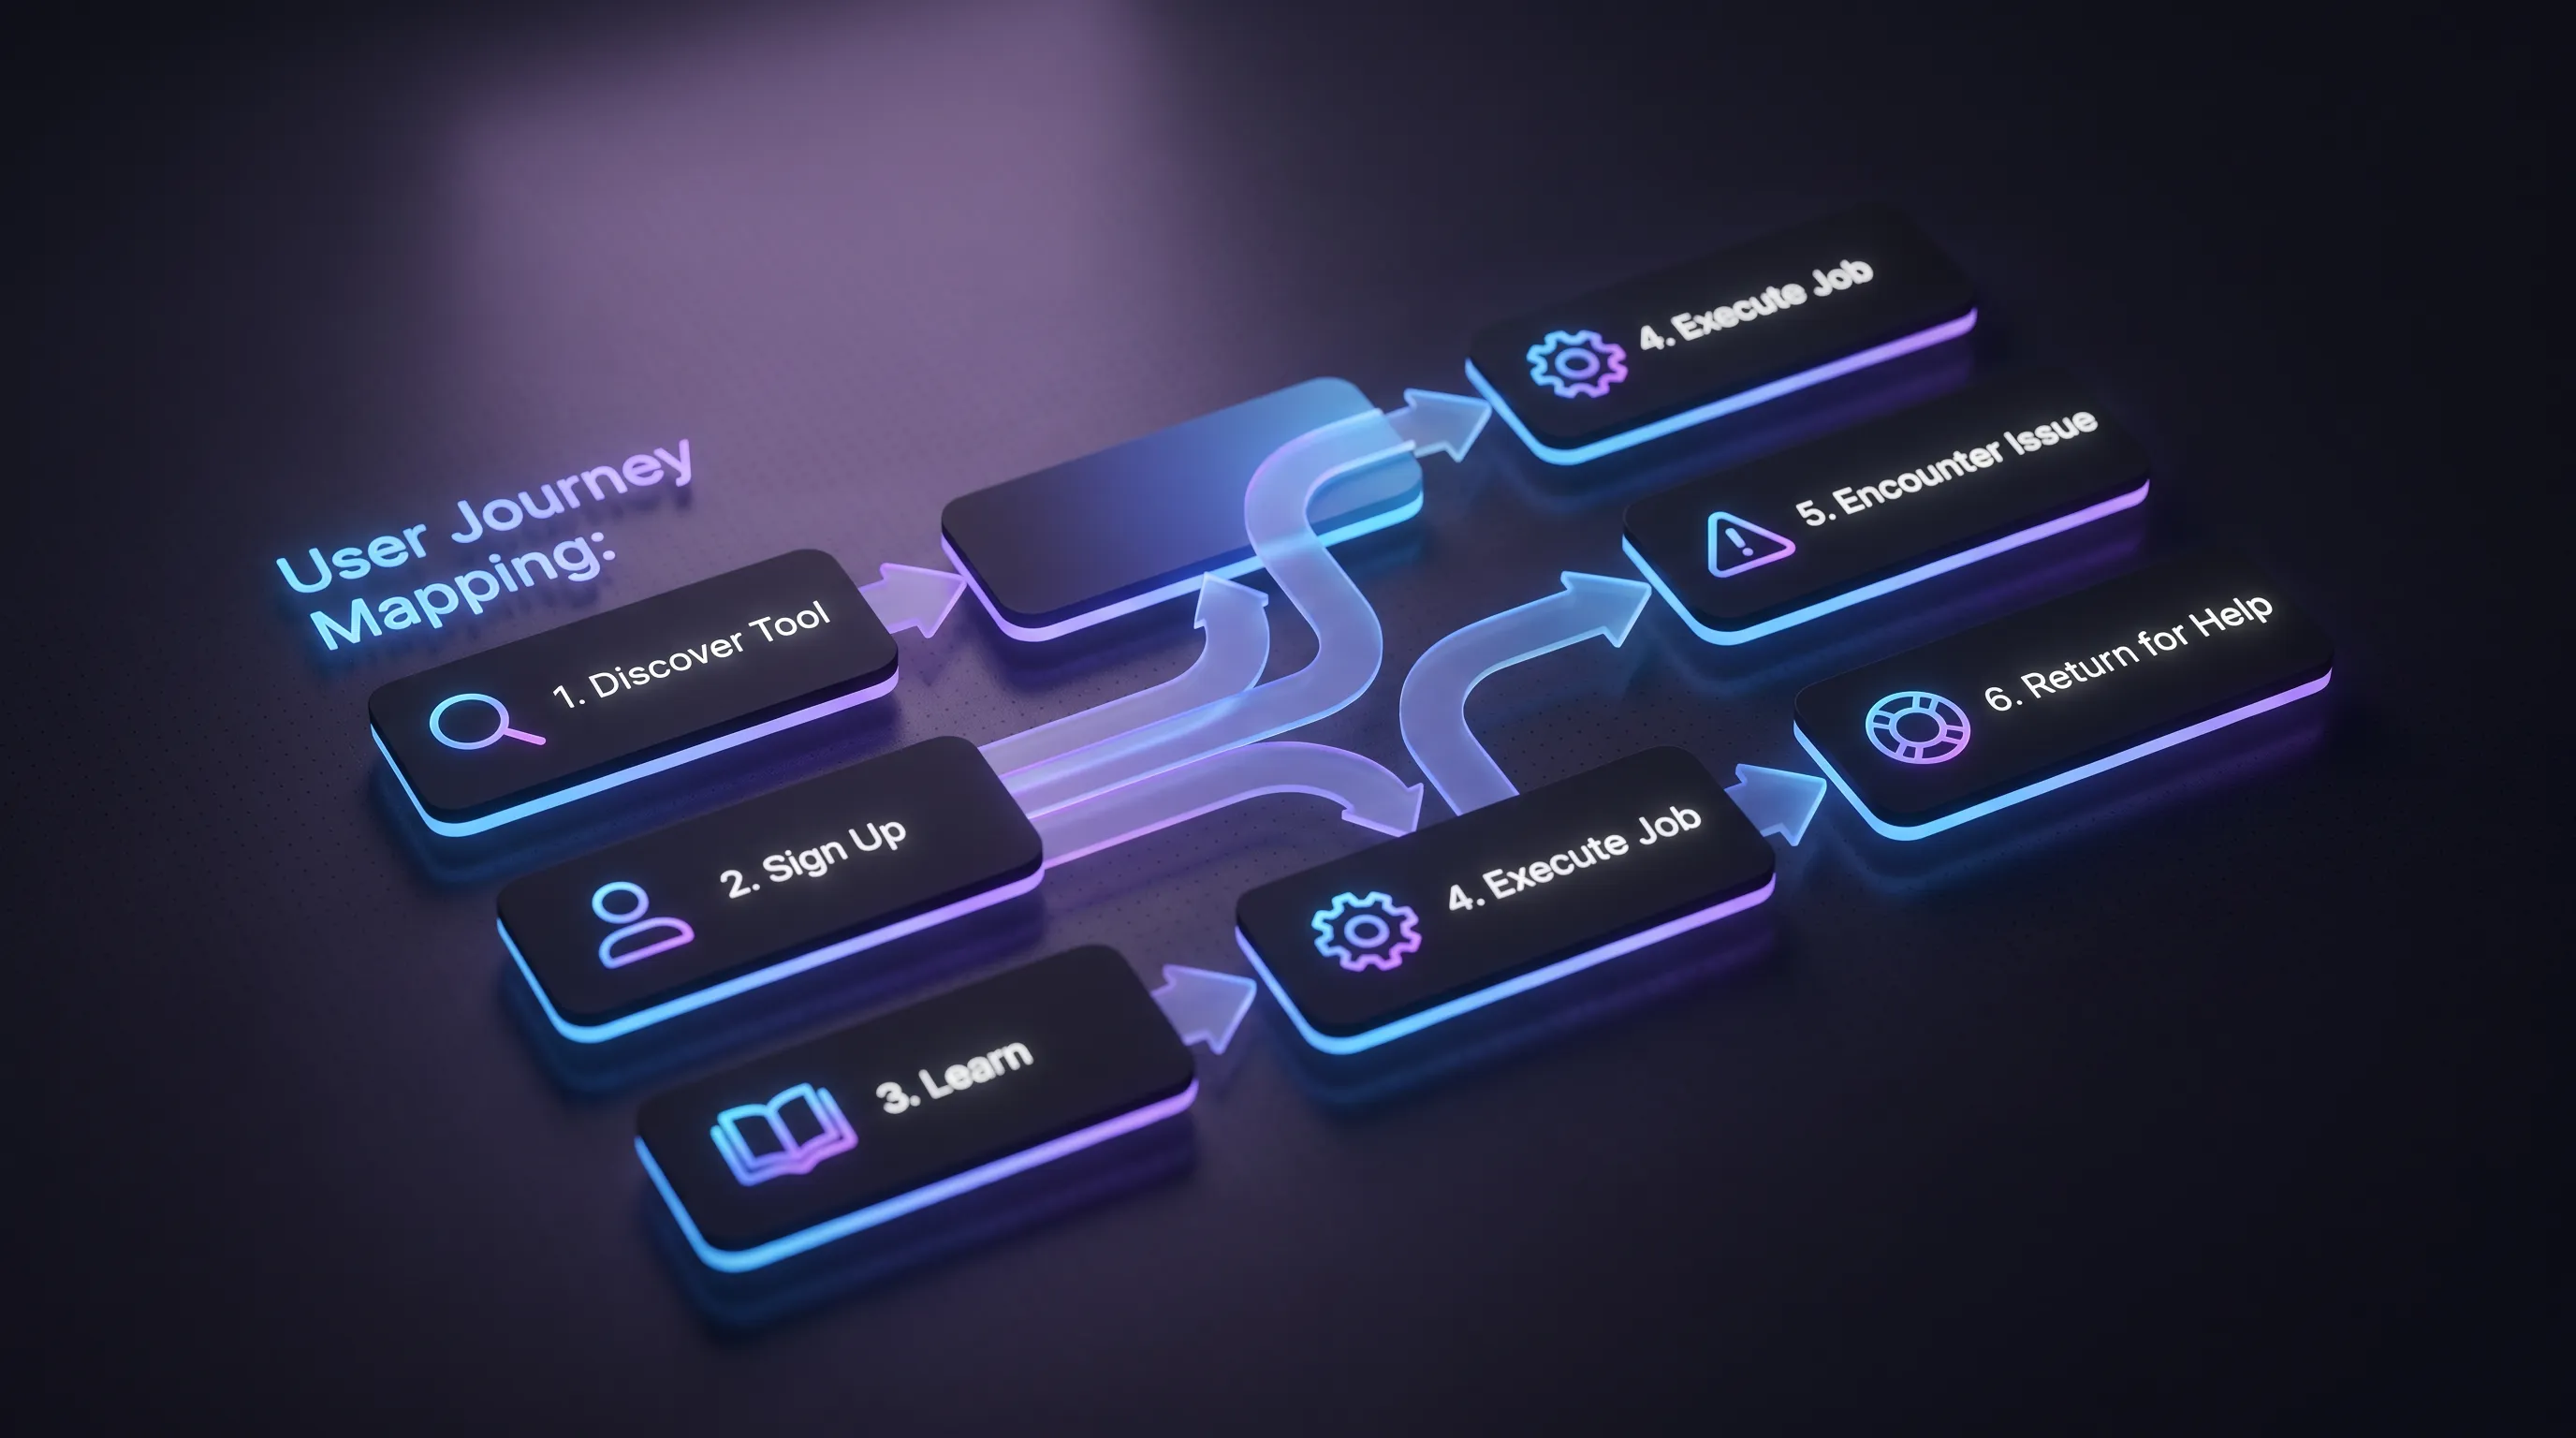
Recovery and return
Things break. What separates products people stay with is what happens next. The W3C requires under Success Criterion 3.3.3 Error Suggestion that when an input error is detected, and a correction is known, the suggestion is given to the user. "Invalid date" fails that. "Enter the date as month/day/year" passes it.
Account recovery deserves its own look, because the person using it has already failed once. WCAG 2.2 addresses it in Success Criterion 3.3.8 Accessible Authentication (Minimum), which says a login step shouldn’t depend on a cognitive function test, such as remembering a password or transcribing characters, unless an alternative or a way to assist is offered. In practice that means allowing paste and password managers, and offering a reset route, such as an emailed link, that doesn’t rely on memory.
Continuity is the other half. WCAG 2.2 added Success Criterion 3.3.7 Redundant Entry, which asks that information a person already entered in a process isn’t demanded again. Saved drafts do the same job.
Some failures can’t be fixed on the screen, and then the journey passes to support. The handoff is where the experience can reset: the person explains the problem again to someone who can’t see what they were doing. Pass the context along instead, meaning the page they were on, the error they saw, and the details they had already entered, so the first reply can start with an answer rather than a question. It is the same principle as redundant entry, applied between teams rather than between form steps. Make the route to a human visible from the error state itself, not buried in a footer.
The last moment in the journey is the return visit, and it starts with a question the product rarely answers: where was I? Someone back on a Tuesday two weeks later needs their place kept, not just their data. That means the draft as they left it, the step they stopped at, and a short note on what has changed since. Put the next action on the first screen they see. Restarting onboarding treats a returning user as a stranger.
The payoff is measurable where anyone bothers to measure it. Counting only the checkout problems it has documented as solvable, Baymard estimates that the average large ecommerce site can gain a 35.26% increase in conversion rate through better checkout design. The figure comes from checkout research, not recovery flows, but the lesson carries over: the gains sit in moments teams rarely examine. Recovery moments are where user journey mapping finds the cheapest wins, because nobody has looked at them.
UX and related disciplines
The words get used interchangeably, and that costs teams clarity in planning meetings. Interface design covers what’s on screen and how it behaves. Usability, in Nielsen Norman Group’s framing, is a quality attribute of the UI covering whether a system is easy to learn and efficient to use.
On the broad view set out earlier, these disciplines sit inside user experience rather than beside it. Interface design and usability cover the part of the experience that lives on the screen. Information architecture is the instrument that shapes how people find their way through it. The billing email, the support reply, and the return visit belong to the same experience as the interface, which is why the journey, not the screen, is the unit worth designing.
None of these disciplines competes with the others. A product can be beautiful and unusable, or usable and pointless. The six moments above fail in different ways and need different specialists, which is the practical reason the distinction is worth keeping.
Evidence guides better design
Opinion scales badly. Nielsen Norman Group defines a journey map as a visualization of the process a person goes through in order to accomplish a goal, and the value of user journey mapping depends entirely on whether the cells are filled with research or with what the room assumed on a Thursday.
Testing doesn't need to be expensive to be useful. Nielsen's advice on budget is blunt: "Spend this budget on 3 studies with 5 users each!" Three rounds of five, with fixes between them, beat one study of fifteen that documents problems you then ship anyway.
Four sources of evidence, each catching what the others miss:
-
Moderated sessions on a prototype, which expose why someone hesitated
-
Behavioural analytics, which show where volume drops without explaining it
-
Support tickets and sales call notes, which name the problem in the customer's own words
-
Automated accessibility scans, worth running given that only 2% of websites pass 70% of testable WCAG criteria in AudioEye's sample
Run these against the same journey. A funnel chart tells you people leave at step four. A recording tells you they left because the field rejected a phone number with spaces in it, and user journey mapping is what connects that detail back to the information architecture decision that put the field there.
Design beyond screens
Pick one real journey and walk it end to end with the people who build it. Start where expectation forms and finish where someone returns after a month away. That’s what user journey mapping is for, and a first pass takes an afternoon. Our team runs these reviews with product groups who know their interface well and want to see what surrounds it. Get in touch if you’d like help turning that review into user experience design work worth funding.