How to Manage an MVP in Software Development After the First Release

Content authorBy Gleb KirsenkoPublished onReading time10 min read
Sleek glossy arches create a virtual tunnel in a dark gradient landscape, with luminous lines suggesting dynamic data movement.

Launch day is when an MVP stops being a hypothesis and starts producing evidence. The assumptions the team built on now meet real usage data, and most teams have no plan for what to do with it. A repeatable MVP cycle in software development turns that data into decisions: measure whether people complete the core journey and come back to it, then decide what to change next based on what you see, not what you expected.

Manage an MVP in software development

Managing an MVP after the first release is a different discipline from building one. Before launch, you argued about assumptions. Now the evidence arrives, and it rarely agrees with anyone in the room. Ronny Kohavi, who founded Microsoft's experimentation platform team, reported that only one-third of experiments designed to improve a key metric actually did.

The failure mode after launch is predictable. Requests pour in from sales and from the three loudest users, and each gets written into the roadmap before anyone has confirmed the core journey works. That turns the next phase into a scope argument instead of a learning question. Run the next phase of MVP as a controlled cycle: measure, then decide.

Instrument the core journey

You can't learn anything from traffic you aren't measuring correctly. Before making any decision based on post-launch data, confirm that your analytics capture whether a new user reaches activation, completes the core task, comes back to do it again, or abandons it partway, and how often they contact support along the way.

Repeat use is the easiest to leave vague, so say what counts as coming back, such as finishing the core task again within a window you set in advance, before you look at the numbers. Each of those needs a written definition that a stranger could read and implement the same way twice.

The MVP vs prototype difference shows up sharply here. A prototype can run on observation and guesswork, but an MVP in software development produces a stream of events that engineering and product read differently unless the definitions are fixed. Gartner's research put the cost of poor data quality at $12.9 million a year for the average organisation, and a startup's version of that cost is six weeks spent optimising a funnel step that was mislabelled.

Validate the tracking before you trust it. Walk the journey yourself on a clean account and check that every event fires once, in order, with the properties you expect. Then compare a day of event volume against a source you already trust, like signup records or payment receipts, and investigate any gap larger than a few percent. This is a form of operational discovery that helps expose issues before they distort decisions.

Protect product reliability

Defects and product questions need separate conversations. When a signup flow drops 40% of users because an email service times out intermittently, that is not evidence about user intent, and treating it as such produces a redesign nobody needed. Keep a hard line between "this is broken" and "this works, but people don't want it."

That line is also where product quality stops being abstract and becomes an operational matter. Frank Robinson, who coined the term at SyncDev in 2001, described the MVP as the product with maximum ROI relative to risk, which means something real users depend on. At this stage, the product has to be reliable enough that the behaviour you observe is the user’s behaviour.

Let's Build Something Great

Tell us about your idea. 24-hour response. NDA-friendly.

Book a Discovery Call →

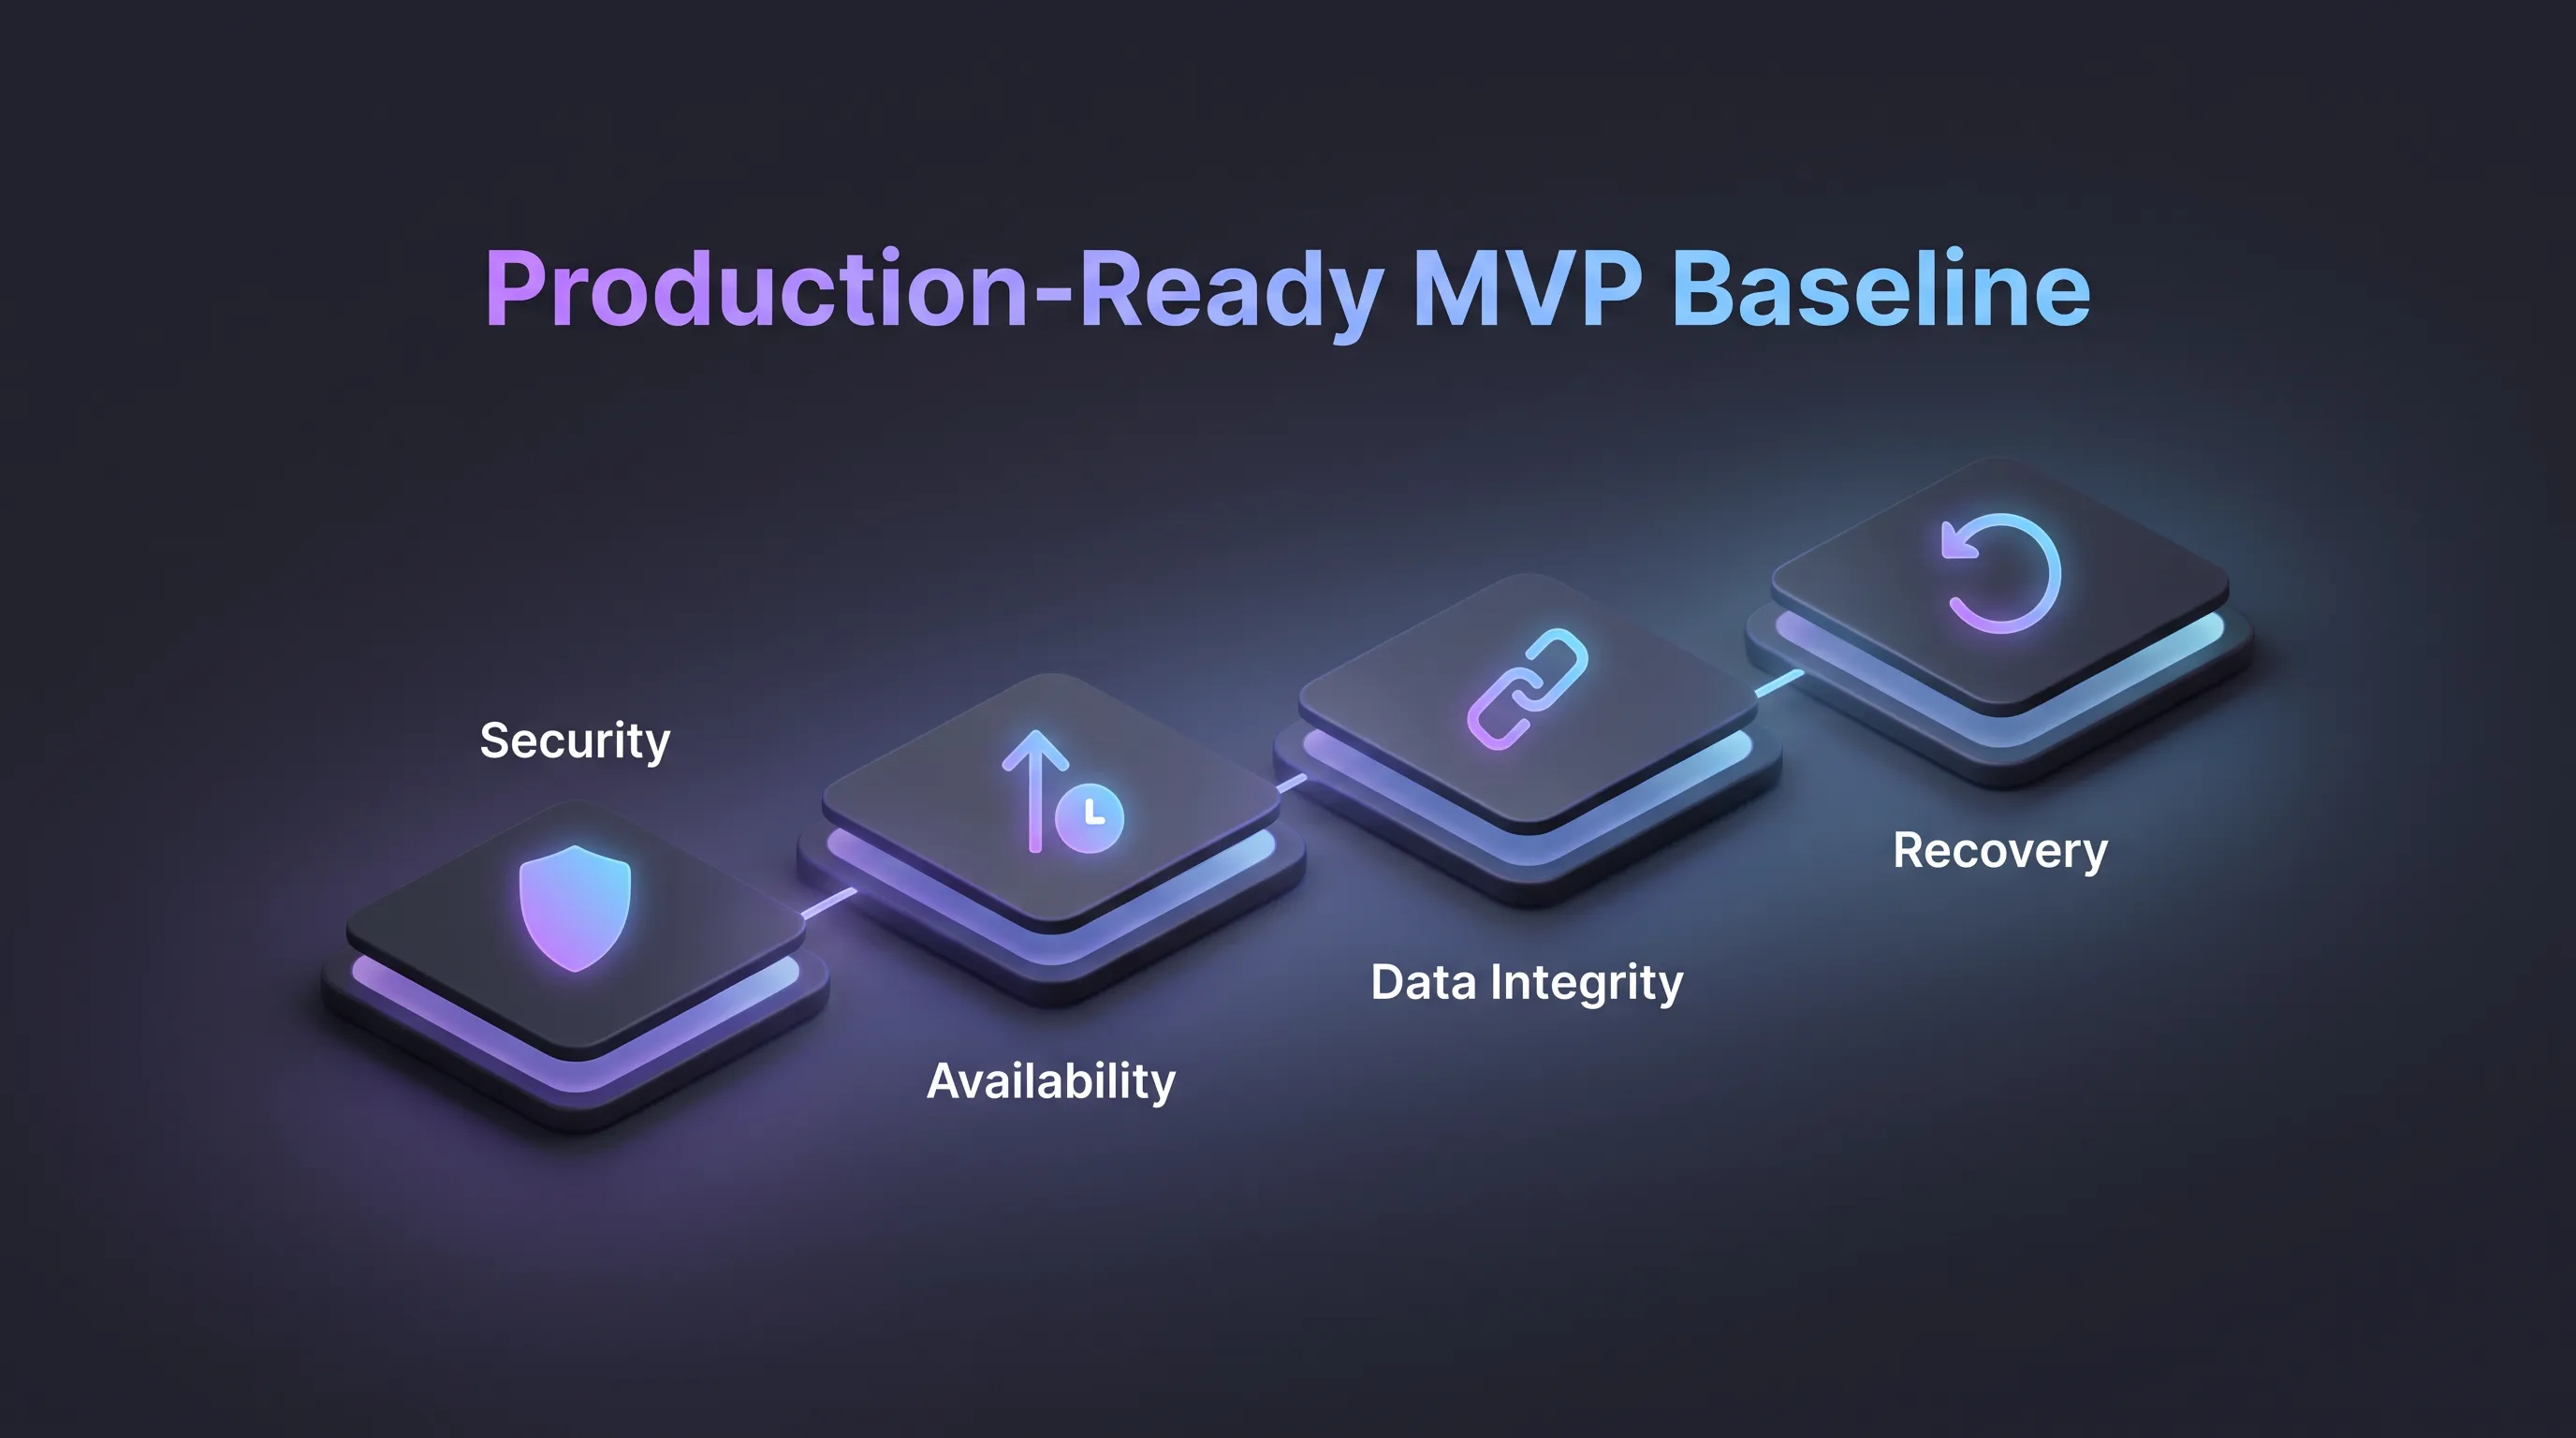
Production-ready MVP baseline

Glowing geometric shapes interact against a dark gradient background, featuring bold text and a step diagram illustrating key concepts.

Set the minimum operational standards in writing before you start testing product changes, so the bar doesn't move every time something breaks. A production-ready MVP should clear these before any experiment runs:

  • Security: authentication and authorisation enforced on the server, secrets out of the client bundle, and dependencies patched on a known schedule.

  • Availability: a stated service level objective for the core journey, with the gap between that target and 100% treated as your error budget in the way Google's SRE team defines it.

  • Data integrity: no silent write failures, validated inputs at the boundary, and an audit trail for anything a user would notice losing.

  • Recovery: a backup you have restored at least once, plus a documented maximum acceptable data loss window.

None of this implies scale. Google's own guidance on setting initial SLOs starts with a small number of targets tied to user experience, and that's the right size for a product with a few hundred accounts.

Logs, alerts, and ownership

Logs are useful when they connect a failure back to a person and a step. Record the error and which stage of the journey the request belongs to. Without that last field, you get a list of exceptions and no way to tell whether they cost you an activation.

Alerts should fire on things a human would act on at 2 am and stay silent otherwise. Tie thresholds to the service level objective you wrote down, not to raw counts, because whether a hundred errors out of two hundred thousand requests is noise depends on your SLO. That is 0.05% of requests: comfortably inside a 99.9% target, but already over budget against 99.99%. A hundred errors out of three hundred is an outage either way. The 2024 DORA research found elite delivery teams running a 5% change failure rate with recovery under an hour, which is achievable at small scale precisely because the system is small.

Name one person as the on-call owner for each week and write it where everyone can see it. Without a named owner, an incident sits in a shared inbox for six hours because three people each assumed another had it. Ownership rotates, but it is never ambiguous.

Combine usage and feedback

Analytics tell you what happened and rarely why. Pair your event data with the records you already have: support conversations and cancellation reasons. Session recordings close part of the gap, and frustration signals like rage clicks and dead clicks, as FullStory defines them, point you at the exact element where expectation and reality diverged.

Then talk to people. Teresa Torres defines continuous discovery as weekly touchpoints with customers conducted by the team building the product, and a weekly cadence is more useful than a quarterly research project because the insight arrives while the decision is still open. Keep the interviews short and anchored to something the person actually did last week.

Sample size works differently for the two kinds of evidence, and teams often get this wrong. Jakob Nielsen's model showed that testing with five users surfaces roughly 85% of usability issues in a qualitative study. His later guidance recommends at least 20 users for quantitative usability metrics, such as task success rate or time on task. That figure does not extend to conversion rates. Five conversations can tell you a button is confusing; neither five nor twenty users can tell you a conversion rate moved, because detecting a change in conversion takes a sample sized with a power calculation for the effect you expect.

Let's Build Something Great

Tell us about your idea. 24-hour response. NDA-friendly.

Book a Discovery Call →

Triage what you learn

Everything you learn goes into one of four queues, and mixing them is how roadmaps rot. Defects are things that don't work as specified. Reliability work is the thing that keeps the baseline intact. Usability barriers stop people from completing a task they're trying to complete, and product requests propose a capability that doesn't exist yet. The argument inside a team about what to build next almost always turns out to be two people sorting the same item into different queues.

Every proposed change has to cite what was observed. Cite a specific behaviour in a specific place with a number attached. Pendo's analysis of anonymised product data found 80% of features are rarely or never used, and request volume is exactly the input that produces that outcome.

Ranking inside each queue is easier once the evidence rule holds. Defects and reliability items get ordered by how many users hit them on the core journey. Usability and product items get ordered by which of Marty Cagan's four product risks they address, with value risk first, because an unusable feature nobody wanted is the most expensive thing you can ship. This is the part of MVP in software development where saying no is the whole job.

Choose the next test

Pick the riskiest assumption still standing: the one that would change your plan if it turned out wrong. Write it as a question that has a wrong answer.

Then state what you expect to see in user behaviour if you're right, and pick the smallest change capable of producing that signal. Kohavi, who led relevance and experimentation at Airbnb, credits that work with 6%+ improvements in booking conversion, and the full method is in the book he co-authored with Diane Tang and Ya Xu, Trustworthy Online Controlled Experiments. Those gains came from many experiments run on a very large user base, so the lesson to take is the discipline: build the least you can get away with to learn the thing.

Agree the thresholds before anyone writes code:

  1. Success: the metric and the size of the move that makes you keep the change.

  2. Failure: the result that makes you remove it, stated as a number.

  3. Safety: the guardrail that stops the test early, like error rate or checkout completion falling below its baseline.

Write these down and date them. A threshold agreed after the data lands is not a threshold.

Release changes safely

Deploy behind a feature flag and turn it on for a small cohort first. Pete Hodgson’s write-up on feature toggles, published on martinfowler.com, describes a canary cohort built from a random sample of 1% of the user base, with the rest of the users untouched while key metrics are compared. At that size, the cohort works as a safety check, read together with interviews, rather than as a statistically valid A/B result.

Run the smoke tests before you widen exposure. Confirm the core journey completes end to end, then watch the journey metric you're testing and the volume of support contacts. Support contacts move first more often than anything on a dashboard, which is why your release process should stay connected to those channels.

Have the rollback tested before you need it. Flipping a flag off is only a rollback if you've confirmed the old path still works and that any data written under the new path doesn't break it. Kohavi recommends starting a ramp at 2% before scaling to larger percentages, for the same reason: the slow ramp gives you time to notice degradation while it's still cheap.

Make evidence-based decisions

Hold one cross-functional review on a fixed schedule and compare results against the thresholds you agreed before release. Eric Ries built a recurring pivot-or-persevere meeting into the method, with a deadline and accountability attached, and the review needs a third outcome as well. Each result ends in one of three decisions: continue, when the thresholds are met; revise, when the signal is mixed, and a specific change could close the gap; or stop, when the thresholds are clearly missed, and no change is likely to fix that. Record the reasoning, and carry only validated learning into the next cycle.

That discipline is what separates a product that improves from one that accumulates features. Praetorix Foundry is a senior-led, product-first studio, and post-launch, the right fit is our Product Partner engagement. If you want help designing the post-release loop for your MVP, talk to us about Product Partner.

Let's Build Something Great

Tell us about your idea. 24-hour response. NDA-friendly.

Book a Discovery Call →

Pause product decisions that depend on the disputed metric. Check event definitions, timestamps, duplicate records, and timezone handling, then compare both sources with a small set of known accounts. Choose a documented source of truth, correct the tracking, and label affected historical data before resuming analysis.

Reproduce the journey with a clean account and inspect errors, latency, failed writes, and missing events before interpreting user behaviour. If the flow works as designed, compare the result with support conversations and interviews. A stable technical path with repeated user objections points toward a product problem.

Stop the experiment when a written safety threshold is breached, such as a rise in errors or a fall in core-task completion. Stop it for a data-integrity problem too, because corrupted results can't support a product decision. Record the trigger, disable the change, and preserve the evidence.

There isn't one fixed number because the required sample depends on baseline conversion, expected effect size, traffic, and test duration. Define those inputs before launch and use a power calculation to set the target. Treat early movement as directional until the planned sample and observation window are complete.

You can propose a change, but one request shouldn't determine the roadmap for an MVP in software development. Record the user's situation, check whether the issue affects the core journey, and look for supporting evidence from behaviour or interviews. Place the item in the correct queue before ranking it.

Book a Discovery Call

Tell us about your idea. 24-hour response. NDA-friendly.

You Might Also Like

Discover more insights and articles